

Luciano Cohan
@luciano
Co-Fundador de Alphacast. Ex Subsecretario de Programación Macroeconómica. Data Science. Creando una plataforma para el trabajo colaborativo en economías
Luciano Cohan
@luciano
Co-Fundador de Alphacast. Ex Subsecretario de Programación Macroeconómica. Data Science. Creando una plataforma para el trabajo colaborativo en economías
luciano's insights
How to convert a series to the official USD or Blue Chip Swap?

The pipeline engine "Apply Transform" step incorporates a new transformation that allows changing the source unit: Convert to dollar official or to Blue Chip Swap (for Argentina only). The pipeline is separated into Two steps Select ("Fetch") the dataset and its columns "Apply transform" by selecting "usddaily", "usdmonthly" or whatever corresponds to the frequency and/or CCL_daily to convert to CCL. Important: This operation uses the "Country" field to identify the country and know which currency to use. In the case of the official currencies, use this reference dataset for the conversion, and in the case of the Argentine CCL...
How is a Time Series seasonally adjusted?

Removing seasonality from time series is always complicated and laborious. The standard deseasonalization method is X-13ARIMA-SEATS or some other version of the methodologies maintained by the United States Census Bureau. Denationalizing usually includes using some application such as Eviews, Demetra or Stata or Python, combining it with the files that are downloaded from Census. Anyone who has also tried to seasonally adjust in Excel knows that it is cumbersome. Just for reference, about the reasons why it is important to deseasonalize the series for the analysis of the situation I wrote this article a while ago. Deseasonalize with Pipelines in Alphacast is very easy and includes only 4 steps: Fetch dataset Filter the columns we want to use (this is not strictly necessary) Step "Apply Transform", choosing the "Seasonal Adjustment" option Chart, download, or publish the dataset As an example, Let's see how to deseasonalize the Monthly Estimator of Economic Activity of Mexico -> This data and Argentina's EMAE -> This...
How to merge the content of two datasets?

Surely in your usual work with data, you needed to join several data sources and if your calculation tool is Excel you may solve it with some combination of the VLOOKUP, HLOOKUP, and/or MATCH formulas. Excel is a great solution in many cases, but it can be difficult in some scenarios. For example when... ...You have MANY rows. VLOOKUP can have performance issues and be very slow ...you need to search more than one field to combine the data ...the position of rows or columns changes ...you only need the data that is in both datasets ...some of the data sources change the number of rows and you have to copy or adjust the formulas. With Alphacast you can use pipelines to combine datasets and keep them connected. Step 1. Choose a data source To merge two datasets, first click the Create new button and choose pipeline. Once there use Fetch dataset to select the required dataset. You can also begin the process by clicking "Transform data" in the dataset you want to merge Step 2. Select the data source to "Merge" Then click Add step below and choose the option Merge with Dataset, there you select the dataset you...
How to calculate a monthly end-of-period series?

Pipelines are an easy way to apply transformations to datasets that update automatically every time data is updated. Suppose we have a daily data series for which we need only the last value of each month. It is possible to do that in Excel. For example, an auxiliary column is added that is TRUE / FALSE depending on whether or not we are on the last day of the month, and then a pivot table or a filter is created, or another table and a vlookup. EOMONTH, for example, is used for that. Doing it with pipelines basically you don't have to do anything. The transformation is done by itself Step 1. Find the dataset and click "Transform Data" Suppose we want a monthly exchange rate series for all countries. Something like this exists in this BIS dataset but with daily frequency: "Financial - Global - BIS - Main Currencies" With the source, dataset identified click "Transform Data" on the dataset view You will now be in the Pipelines Editor Step 2. Choose the step "Resample frequency" A step is added to perform a "Frequency Resample". The source data is daily - this will be automatically detected - and then...
Debt Sustainability Analysis - Costa Rica Dec 2022

Our Debt Sustainability Model uses the standard debt dynamic equation to generate forecasts for the Debt/GDP ratio throughout the next 10 years. Specifically, we use the following equation: $$ d{t+1} =d{t}\biggl[(1-\alpha)\biggl(\frac{1+i{dt}}{(1+gt)(1+\pit)}\biggl) +(\alpha)\biggl(\frac{(1+\Delta\epsilont)(1+i{ft})}{(1+gt)(1+\pit)}\biggl)\biggl] + pdt $$ In which: $$d_{t+1}$$ is the ratio Debt/GDP for the t+1 period; $$\alpha$$ is the share of foreign debt in relation to total debt; $$g_t$$ is the real growth of GDP at the period t; $$\pi_t$$ is the variation of the GDP deflator for the period t; $$\Delta\epsilon_t$$ is the devaluation of the exchange rate between the local currency to the US dollar during the period t; $$i_{dt}$$ is the implicit interest rate for the domestic debt, it is calculated as the ratio between the interest paid for the internal debt during the period t and the internal debt in the period t-1; $$i_{ft}$$ is the implicit interest rate for the foreign debt, it is calculated as the ratio between the interest paid for the internal debt during the period t and the internal debt in the period t-1; $$pd_t$$ is the primary deficit of the government during the period t. We account for uncertainty by applying random shocks for each variable. These shocks are constructed...
Debt Sustainability Analysis - Colombia Dec 2022

Our Debt Sustainability Model uses the standard debt dynamic equation to generate forecasts for the Debt/GDP ratio throughout the next 10 years. Specifically, we use the following the equation: $$ d{t+1} =d{t}\biggl[(1-\alpha)\biggl(\frac{1+i{dt}}{(1+gt)(1+\pit)}\biggl) +(\alpha)\biggl(\frac{(1+\Delta\epsilont)(1+i{ft})}{(1+gt)(1+\pit)}\biggl)\biggl] + pdt $$ In which: $$d_{t+1}$$ is the ratio Debt/GDP for the t+1 period; $$\alpha$$ is the share of foreign debt in relation to total debt; $$g_t$$ is the real growth of GDP at the period t; $$\pi_t$$ is the variation of the GDP deflator for the period t; $$\Delta\epsilon_t$$ is the devaluation of the exchange rate between the local currency to the US dollar during the period t; $$i_{dt}$$ is the implicit interest rate for the domestic debt, it is calculated as the ratio between the interest paid for the internal debt during the period t and the internal debt in the period t-1; $$i_{ft}$$ is the implicit interest rate for the foreign debt, it is calculated as the ratio between the interest paid for the internal debt during the period t and the internal debt in the period t-1; $$pd_t$$ is the primary deficit of the government during the period t. We account for uncertainty by applying random shocks for each variable. These shocks are...
Alphacast Highlight - Latin America slowing down.

Global growth is slowing, USA demand has been dwindling for two quarters in a row, Europe is in the middle of a historical energy crisis, and China faces threats that leave "Chinese growth" years far in the past. Most analysts foresee further deceleration for 2023. What to expect for Latin America in this context? In terms of middle/long-term growth, Latin America can be split into three groups: The smaller-pacific-growing-countries: Colombia (3.0% 10 years average), Peru (2.8%), and Chile 2.1%, and the bigger-slow-or-no-growth Mexico (1.2%), Brazil (0.2%) and Argentina (0.2%). Uruguay (1.5%) stands in the middle. Smaller-pacific-growing-countries Colombia is the fastest-growing economy in the region. It is expected to grow 6.0% in 2022 and accumulates a strong 9.0% growth vs. the pre-pandemic levels. Colombia's growth this year has been fueled by the growth of exports, remittances, and a positive fiscal shock pushed by the electoral cycle. However, the Colombian economy is still adapting to the political swing of the Petro Administration, the first left-wing president ever! The macro flashes multiple warnings, and consensus for 2023 points to deceleration to 2.3%. 75% of Colombia's global demand is explained by private consumption, the highest figure in the region, and consumption is posed to...
Alphacast Highlight - Is Egypt heading to become the next Argentine?

War and inflation have shifted the global economic outlook and the rising tides of global interest rates are adding pressure to emerging economies. Among them, Egypt is beginning to stand out due to large imbalances and high global financial cycle exposure. How much is the margin to avoid a balance of payments crisis in the near future? Egypt ranks at the top on typical macro imbalances ratios. They are, at the same time, in the top 20 ranks in terms of forecasted current account deficit for 2022 and in the top 10 in interest payment to GDP. External short-term debt has risen to 4.5% and reserves are already dwindling, and now cover 5 months of imports, 5 years low. On the other hand, while gross external debt still looks in the safe zone (25%), the overall public debt is almost 90% of GDP and yearly gross financing needs account for 30% of GDP. Since the onset of the war in February, Egyptian sovereign debt has been hit. The Yield Curve moved upward in line with global rates (about 300bp) but spreads vs the USA are hitting 4 years highs. So, Looking forward, the hindsight provided by Argentina's 2017-2018 crisis looks...
Alphacast Highlight - The Chilean Roallercoaster

Despite the historical strong fundamentals, the combined effect of COVID, the Russia-Ukrainian War, and a visible shift in economic policy has cornered the Chilean economy into an atypical, unstable trend. Chile was strongly hit by the COVID lockdown in 2020. The economy saw a contraction of 15% at the peak of the crisis. The contraction was mild compared with its regional peers, and recovery was strong: current activity levels are about 8% above pre-COVID. However, most of this happened in 2021. For more than half a year now the economy looks stagnant. A surprising jobless recovery, like in many other countries around the globe. Unemployment levels are back on pre-COVID levels but with activity levels almost 3% below. After COVID about 5% of the people simply left the labor market. Chilean inflation has risen in line with increasing global energy and food prices, but Chile is ranking among the worst performers in the region (excluding of course Argentina). This has happened even though Chilean Central Bank turned hawkish and raised policy rates 7 times to 8,25%. Not enough, however, to stop real rates from turning negative to decades-low levels. External shocks explain most of the inflation acceleration but the pervasive...
A short guide to Argentina's Mutual Funds Industry Analysis

In this short tutorial, we will guide you on calculating ranks of YTD Total Returns* for different funds and management companies.* Alphacast hosts a number of daily updated datasets of Argentinas Mutual Funds Industry. Two weeks ago we began publishing detailed datasets for based on CAFCI daily reports, mostly in these two repositories (1 and 2 ). Data covers Assets Under Management (AUM) by Fund, Detailed Portfolio by Fund, Price and Subscription Effect by Fund and Class (Data and Calculation) and Metadata per Fund and per Asset. Calculating the total return of each Fund Subsegment (Clase) Price, quantities, and AUM data from CAFCI are provided for each subsegment of each fund (Clase A - B - C, etc). We will begin by calculating a measure of total return for each class. You can see this pipeline for a working example of this section. The first steps load and filter the data that we will be using. We will be working with data from the dataset Financial - Argentina - Fondos Comunes de Inversion - 2022 from CAFCI. The next two steps calculate the contribution of the "price effect" and "subscription effect" to the daily change in the fund AUM. Basically,...
A short guide to Argentina's Financial and Monetary Data

There are more than 2.000 datasets in Alphacast, and there are plenty of hidden gems. This is a short "Must see" guide for those interested in Argentina's financial and monetary data. **Would you like to know more? Write to hello@alphacast.io o book a demo!** There are lots of based on the data from IAMC daily reports. We encourage you to take advantage of the following datasets: Bonds: Sovereign, Subnational and Corporate IAMC's bonds index in ARS and USD. Treasury Bills: both fixed-rate (LEDES) and inflation-linked (LECER) Leading Equity Trading Volumes Moreover, historical data series for sovereign bonds can be found in this dataset while this one is always updated with the last price Users have also created some pipelines based on this data. For example, you can see (and clone) this pipeline that calculates C vs D spreads or this one, that estimates MEP and CCL from bonds prices Two weeks ago we began publishing detailed datasets for the Mutual Funds industry, based on CAFCI daily reports. You can access that data in these two repositories (1 and 2 ) Net Worth by Fund Detailed Portfolio by Fund (https://www.alphacast.io/datasets/29744) Effect Price and Subscription by Fund and Class (Data and Calculation...
It's one small step for Alphacast, one giant leap for data

It's one small step for Alphacast, one giant leap for data Hello, everyone! It's been a couple of weeks since our last update. We have been doing a lot of work under the hood, particularly trying to improve the readiness of the data on the platform, the overall performance of the Notebooks, and the content you see when you interact with Alphacast (i.e. through emails, related datasets, etc). However, there have been major additions to our pipeline engine. Enjoy X new step! New Steps: FRED! If you work with economic data you probably know FRED, the massive database created by the US Federal Reserve Bank of Saint Louis, that claims to have 816,000 US and international time series from 108 sources. You can now access all that data directly into Alphacast, using Alphacast pipelines. Learn more here. New Steps: Wide to Long (melt), Long to Wide (unstack) If you work with data you probably have come to the scenario where you have found the data you need but not in the shape that you need it. A typical example is when data that should be row values are columns or otherwise, a situation that cannot be solved by simply transposing...
How can I reshape my dataset from "Long" format to "Wide" format and otherwise?

If you work with data you probably have come to the scenario where you have found the data you need but not in the shape that you need. A typical example is when data that should be row values are columns or otherwise, a situation that can not be solved by simply transposing the data. "Wide to Long" and "Long to Wide" steps are useful to solve this. Let's see an example. See the pipeline here Let's begin by loading some Yahoo Finance data. You will notice the Tickers (Apple, Microsoft, Google. etc) values in the column "Ticker". Let's assume that you need them to be columns, side by side and that you only need the Closing price and not Open-High-Low-Close. Next, add a step "Long to Wide (Unstack" to the pipeline. And the resulting dataset will look like these If you want to reverse this process use the step "Wide to Long" in which case you need to define what will be the name of the column that will now host the tickers and the name of the columns that will have the values. Also you can check and uncheck which columns should be "melted" and uncheck those that...
How can I download Data from the Federal Reserve Bank of St. Louis Database (FRED) ?

If you work with economic data you probably know FRED, the massive database created by the US Federal Reserve Bank of Saint Louis, that claims to have 816,000 US and international time series from 108 sources. You can now access all that data directly into Alphacast, using Alphacast pipelines. Creating a dataset or pipeline by importing from Yahoo finance is as simple as 1 Create a new pipeline (Top right --> Create New --> Pipeline) and choose "FRED" as your data source. 2.To load data into Alphacast you need to know the series Code. Each series has a unique code that can be found in two places on FRED site. On the URL and next to its name. In the following example the series code is T10Y2Y and MORTGAGE30US 3.Include as many series as you like, separating them by a comma. See a working example here 4.Ready! You can now publish the dataset, chart the data, process it or any other cool option available in...
Crypto is painfully discovering that it is part of the global financial system

A small contribution on the topic of this week: The collapse that part of the crypto ecosystem is experiencing. Word of advice: I know little about crypto and I am hardly going to talk about crypto except to say one thing: Crypto is painfully discovering that it is part of the global financial system Crypto, in addition to being a disruptive, decentralizing, and democratizing technological innovation, is a financial asset. That means that its price is increasingly determined by factors that affect financial assets and less x those that affect "technology" It is neither the first nor the only asset that underwent a similar process. Commodities, for example, became much more financial in the 1990s and early 2000s. In the global price of wheat, the conditions of the wheat market (climate, demand, supply) always mattered, but increasingly influential were its financial determinants. Buying or selling wheat became part of a portfolio decision. It even happened, for example, with other obviously financial assets: currency. Only in the 60s/70s did the economic science - while financial globalization advanced - began to think of the price of currencies as that of an asset and less as something that happens in the currency market...
Pipelines examples and tutorials
How do I calculate a monthly end-of-period series from daily data? How do I change the frequency of the data? How can I merge two datasets into one? How can I connect the results of my pipeline to Excel? How is a time series seasonally adjusted? How do I change a local currency series to dollars? How can I download Data from Yahoo Finance? How can I download Data from FRED? How can I remove or regroup entities of my dataset? How can i reshape my dataset from "Wide" format to "Long" format and...
How to integrate Alphacast with Excel and Google Sheets?

Excel and Google Sheets allow adding data from different sources. Here you can find an alternative way to embed data into Excel, by using our TSV data source: Step 1. Getting the download link From a Dataset First of all, filter the information you want to use. Excel and Google Sheet limit the information that can be downloaded to a maximum, so it is convenient to apply the filters you need. Once you've done the filter, click on the Download button. Then select the format you want: TSV (for integrations with Excel for Mac), CSV, or Excel and choose Copy Link. You will notice the URL already has your personal API key (which should not be shared publicly with other users, outside your team). From a Pipeline Within any pipeline, you can create a Data Snapshot to get a Download Link for the data up to that point. Use the XLSX Download link and follow Step 2. Step 2. Integrating to Excel or Google Sheets Excel Now go to Excel, select Get Data > From Other Sources > From Web, and enter the URL you copied from the Alphacast website. The following GIF guides you through a successful Excel integration!...
Pipeline's Steps Library
Index - Data Sources - Dataset Transforms - Basic Arithmetics - Finance - Publish data Data Sources Fetch Dataset: This step allows you to choose the dataset to which the sequence of pipeline steps can be added. This step is already predefined and is usually the first step of a pipeline Learn More Fetch Yahoo Finance: Yahoo Finance has information on hundreds of thousands of financial assets, stocks, bonds, ETFs, Indices, which are now easily accessible using Alphacast pipelines. Learn More Fetch FRED: If you work with economic data you probably know FRED, the massive database created by the US Federal Reserve Bank of Saint Louis, that claims to have 816,000 US and international time series from 108 sources. You can now access all that data directly into Alphacast, using Alphacast pipelines.. Learn More Dataset Transforms Select Columns: This step allows to filter columns and reduce the number of data to be processed in the following step. The variable selector will show the data up to that point in the pipeline. Learn More Rename Columns: the user can choose the name for each column by filling in the blank space to the right, or keeping the original name by leaving...
Automatización de Analisis de Coyuntura - Clase 6.
Luciano Cohan luciano@alphacast.op 1. ¿Cómo cargar, gráficar y conectar datos de Yahoo finance? 2. ¿Cómo calcular un Total Return con el Formula Editor? 3.¿Cómo armar una tabla descriptiva siempre actualizada? 4. static and dynamics tear-sheets 5. Indicadores de Analisis técnico 6. Estrategias de Precios -->...
Alphacast Wednesday Update - April 13th, 2022

The last weeks have been great. We have seen lots of users flowing into what we think is becoming the core feature of Alphacast: the pipelines engine. We have been interviewing users and seeing how you are interacting with these new features: We discovered that users are not only creating pipelines to automatize processes but also as a workspace, to analyze the data and be able to "tell stories" with it. That's why we have come to a new product roadmap for Q2:2022: Notebooks! Introducing Alphacast Notebooks! Creating content in Alphacast often involves a back and forth between tabs. Search data, then go from Dataset to Pipeline, Back to Datasets, then to create a chart and then an insight to embed it, and back to square one. Complex pipelines and reports require no less than five open Tabs. We are working to combine the full experience of creating content into a single screen. Load the data, transform and visualize it, include comments, and tell the story. Use the new "Notebook" as a workspace to find, analyze and share data. As a first step, a new feature is in test mode: you can now create and edit a chart directly in...
How can I create a Portfolio Tear-Sheet?

Alphacast pipelines can be used to design and test portfolio and trading strategies. With the "Porfolio Analysis" Step on the pipeline editor you can create tear-sheets from daily returns and also dynamic rolling stats for different timeframes. Step 1. Load the data and calculate a daily return variable. You can use any dataset you want to calculate daily returns. As an example, let's load Yahoo Finance data and calculate the daily return of three assets In the pipeline editor (Click on create new at the top right --> Pipeline) Add Yahoo Finance as your source add the tickers that you want to analyze (i.e. MSFT, AAPL, GOOG) Select the period add a new step to "Calculate Variable" write the formula pct_change(@Close,1,@Ticker) Step 2. Calculate the portfolio Tear Sheet Add a new step "Portfolio Analysis" Select the metrics that you want to calculate for your portfolio. Available stats are'**Annual return, Cumulative returns, Annual volatility, Sharpe ratio, Calmar ratio, Stability, Max drawdown, Omega ratio, Sortino ratio, Skew, Kurtosis, Tail ratio, Daily value at risk, Total Return Select the variable with the daily returns. "pct_change" in this example If Tear-sheet option is on then a single Tear sheet with results will be calculate...
Alphacast Friday Update - April 1st, 2022

March and Q1 have come to an end and, when we compare the platform today vs. what we had just one month ago we see changes almost everywhere! Let us do a short recap of what happened in the last two weeks. A new, super-powerful formula editor: Group, rolling windows, time functions and much more. The "Calculate Variable" is getting VERY powerful and versatile allowing more complex calculations to be done with a simple excelish formula parser. See the full list of formulas here The first step is to create a pipeline (click on "Create new --> Pipeline" on the top right) and select a data source, followed by "add step below --> Calculate Variable" Video Tutorial (In Spanish) The editor is really powerful, just to catch a glimpse on some formulas that can be created log(@Close)+ sqrt(@Volume)) log(exp(@Close)) Example: Calculate for each ticker the cumulative price change vs the first price Example: Calculate the cumulative sales per salesperson cumsum(@sales, @salesperson) Example: Calculate for each date the share of sales explained by each product vs the total sales of that date Example: calculate the 20 day moving average for each ticker rollingmean(@Close, 20, @Ticker) Example: Extract the year from the...
How to calculate a variable with the formula editor
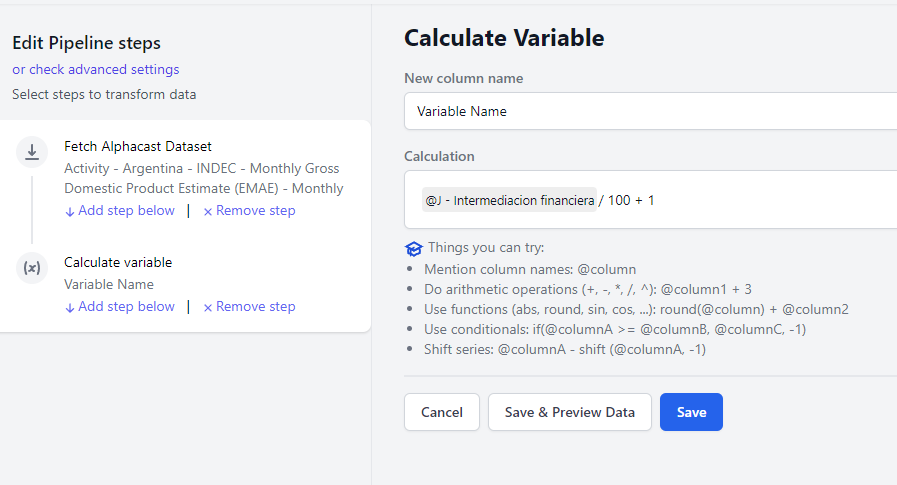
The calculate variable step is an all-purpose formula parser to create new variables in a more "Excelish" way. There are dozens of operators, comparisons, and functions that allow endless combinations. For a comprehensive list of functions and operands see here Video Tutorial (Spanish) First step. Writing a basic formula The first step is to create a pipeline (click on "Create new --> Pipeline" on the top right) and select a data source, followed by "add step below --> Calculate Variable" There are a couple of rules to creating new variables Select a name on the textbox. If you select a variable name that already exists it will be overwritten You can use @ to select variables of the dataset. Start writing the name of the variables and options will show up You can do basic arithmetic operations such as (+, -, *, /, ^): @column1 + 3 You can use functions by typing the name followed by parenthesis and commas to separate parameters: round(@column) + @column2. Full list of functions is here: here. The formula will always return the same number of rows as the original datasets, even if it involves calculations that usually reduce the dimensionality such as "Total...
Formula Editor: All functions and operators
Operators "+": Add. A + B "-": Substraction. A - B "": Multiply. A B "/": Divide. A / B "^": Power. A ^ B Comparison ">": Greater. ">=": Greater Than "": Not Equal "= 0, 1, -1) Row Functions These functions are calculated through all the values of the column (different than group functions below) "power": Power(A, B) "exp": Exponential(A, B) "sqrt": Square Root(A) "log": Log(A) "log10": Log10(A) "sgn": Sign. Positive = 1, Negative -1. sng(A) "abs": Absolute value. abs (A) "trunc": Truncate integer. trunc(A) "round": Round to N digits. round(A, N) "floor": Closest intereg lower or equal than value. floor(A) "ceil": Closest intereg higher or equal than value. ceil(A) "sin": sin "cos": cos "tan": tan Group Functions These functions are calculated within groups. Groups are defined by the columns defined by the parameters. The default groups are the entities of the Dataset (excluding the Date columns) "rank": Compute numerical data ranks (1 through n) rank(@Variable, @entity1, @entity2, ...) "cummax": Cumulative max per group. cummax(@Variable, @entity1, @entity2, ...) "cummin": Cumulative min per group "cumprod": Cumulative min per group "cumsum": Cumulative sum per group "cumcount": Cumulative count per group "backfill": backfills NA values "pad": forward fills NA values "pctchange": pctchange...
Alphacast Friday Update - March 11th, 2022

Welcome to another update! There are new features and improvements almost everywhere in the platform, as we have been focusing on User Experience, navigation, and bug fixing. You should notice faster navigation, better search results, and small updates everywhere. The most highlighted pieces of news are: Publishers Publishing! We have seen a lot of publishers' activity this week. Find out content by: Econviews Econ.uy Enrique Roura 1 2 Ivan Baumann CREEBBA The course "Automation of Economic and Financial Analysis" has begun Watch the video and presentation of the first class, or subscribe here. Next class, on Wednesday 16th, will be about pipelines and transformations. New Learning Center & Home Page We have made a full revamp of our Learning Center and our Home Page. In the new Learning Center, you will find improved documentation, examples, tutorials, and more. Advanced formula editor (conditionals, shift, and more) We have powered up the "Calculate Variable" step in the pipelines editors. There is now more flexibility to calculate new columns in a more "Excelish" way. There are now two new functionalities to the formula editor: Conditionals and the possibility to Shift the data N periods: A positive N lead will move the data N...
Debt Sustainability Analysis - V1

Our Debt Sustainability Model uses the standard debt dynamic equation to generate forecasts for the Debt/GDP ratio throughout the next 10 years. Specifically, we use the following the equation: $$ d{t+1} =d{t}\biggl[(1-\alpha)\biggl(\frac{1+i{dt}}{(1+gt)(1+\pit)}\biggl) +(\alpha)\biggl(\frac{(1+\Delta\epsilont)(1+i{ft})}{(1+gt)(1+\pit)}\biggl)\biggl] + pdt $$ In which: $$d_{t+1}$$ is the ratio Debt/GDP for the t+1 period; $$\alpha$$ is the share of foreign debt in relation to total debt; $$g_t$$ is the real growth of GDP at the period t; $$\pi_t$$ is the variation of the GDP deflator for the period t; $$\Delta\epsilon_t$$ is the devaluation of the exchange rate between the local currency to the US dollar during the period t; $$i_{dt}$$ is the implicit interest rate for the domestic debt, it is calculates as the ratio between the interest paid for the internal debt during the period t and the internal debt in the period t-1; $$i_{ft}$$ is the implicit interest rate for the foreign debt, it is calculates as the ratio between the interest paid for the internal debt during the period t and the internal debt in the period t-1; $$pd_t$$ is the primary deficit of the government during the period t. We account for uncertainty by applying random shocks for each variable. These shocks are...
Automatización de Análisis de Coyuntura - Clase 1

Introducción general. Objetivos del Curso Alphacast Basics [HOY] Datasets, Charts, Maps y Dashboards Data Flows: Pipelines y Transformaciones Integrations: Python, Excel, Google Drive, Power Bi Aplicaciones y casos de uso Intro to Web Scrapping in Python Intro a Algotrading Intro to Time Series Forecasting Intro a Machine Learning Alphacast Basics Nuestro objetivo es ayudar a los equipos y profesionales de Economía y Finanzas a encontrar, procesar y compartir datos y analisis. Perfil de usuarios de Alphacast: Estudiantes, aficionados a la economía y finanzas, Consultoras, Analistas de Research de Bancos, Fondos de Inversion, Brokers, Centros de Investigación y Think Tanks El contenido de la plataforma. ¿Que? ¿Quien? ¿Como? ¿Donde? ¿Quien produce el contenido? Alphacast Open source Featured Publishers Los Usuarios El contenido puede ser publico, privado o bajo suscripción. Alphacast es una plataforma donde puede comprar y vender datos y analisis Algunos ejemplos: Econviews, Enrique Roura, Ivan Baumann, CREEBA, ECON-UY ¿Cómo encuentro el contenido? Search Explore Community Tags / Filters ¿Las distintas "Clases" de contenido? Creacion de Datasets, Charts, Maps y Dashboards Creación, actualización y manejo de datos La vista del dataset Download Filter Transform Data [proxima clase] Sync Now --> Open Source ¿Que son las entities? Conectando un Dataset a...
How to create basic maps?
In order to create a basic map, click on the Create new button in the upper right corner and choose the Chart option. Once in the editor, make sure you have the Map tab option checked (below the Type of chart dropdown). You can create a chart with a line chart and a map, notice that in the chart viewer, in the lower left corner are the chart and map options. If you only want the map chart, uncheck the Chart tab option. Note that selecting the Map tab option opens a new tab called Map that allows you to make changes. The most important is Unmatched Entities, which allows you to match entities that have not been recognized by the editor. You can only make a map with a single variable that has data for different countries or provinces. For example, the only variable may be GDP and there are different data for the countries. It is important that the country in question is in the country field. If in the Data tab it appears as undefined, a change must be made in the entities of the...
Teams Frequently Asked Questions
What is a Team? The main objective of this function is team collaboration between different users either to collaborate on a project or for a specific work area. When you belong to a team, the information will be visible only to its members. How do I create a team and add participants? To create a Team, you must first go to Your profile in the upper right corner of the site. Once in the profile view, click on settings and then on the Teams tab. There select Create new team. Finally, a name is assigned to the team, the users who are members of the team are added et voilá! To add them you can do it with the Alphacast username or with the e-mail. If you put the wrong user, you can easily remove it by pressing Remove. Even if you have already created the group, you can also change its members at any time. When you access the Teams tab, the groups listed appear, and there you can delete them. If you do it that way, don't forget to hit Update team to save your changes. How do I change the permissions that team members have? There are...
Charts and Maps Library

Country Level Maps State Level Maps We added Sub National level maps. You can easily map the data by having the state/province as your entity. The editor will recognize the state/province and map it accordingly and if it doesn't you can match your data with the map geographies. World Map, US, Brazil & Argentina are already on board and we are adding new maps on a daily basis. If you need a specific map just let us know! Line chart Charts with two axis Dual Chart Combined charts: Lines and Bars Scatter plot Time Scatter Stacked area Bar Chart Stacked lines and or bars Discrete bar Slope...
How to connect to STATA or Power BI?

Connecting Alphacast to other tools is really simple using the following steps Find the data you want to connect to your tool and copy the download link When you navigate through Datasets in Alphacast, you will find a Download link (you have to be logged in). If you filter variables, download links will consider variables selection, and only filtered variables will be downloaded. You will now find an option to download Comma Separated Values (CSV): Right click on the CSV Download link, and choose "Copy Link Address". You will notice the URL already has your personal api_key, and should not be shared publicly with other users, outside your team. It will look like this THEURL = https://api.alphacast.io/datasets/5288/data?apiKey=YOURAPI_KEY&format=csv Connecting to STATA Data can be connected to STATA with a single line insheet using "THE_URL" Connecting to Power BI Integrating Alphacast with Power BI is straightforward. You will need the complete URL for the dataset that you want to integrate, which you can find by clicking the Download button and then copying (not downloading!) the URL attached to a TSV file. Once you have the corresponding URL, you should click on “Get Data”, and then “Web”. Then paste the corresponding URL and...
Beginners guide to Alphacast
Alphacast is an integrated platform for economic and financial analysis. Our goal is to help you use your time wisely. Stop spending your day copying & pasting data from sources that frequently change their formats, or updating charts. Keep your files, scripts, and charts always up to date. Have all the data and charts you need in a single place and discover new data and ideas from the community. There are many things you and your team can do with Alphacast. Download and create data or dashboards, integrate with R or Python or Power-bi, create interactive charts o maps or transform the data with pipelines. but let's start from the beginning Downloading your first dataset Let's start by finding some data you need, say, for example. Argentina's Consumer Price Index. Go to Search at the top right of your screen. Type "Inflation Argentina", search and select any dataset, for example "Inflation - Argentina - INDEC - Consumer Price Index - Groups - Monthly" Filter the data that you need. You can filter variables, entities and, in some datasets, also pre-defined transformations. You will see how the preview on the right bar changes (if you want to get adventurous, click "Create...
How can I search and download data?
To explore and search for a dataset you can go to the explore tab, located at the upper left bar or access it from the home clicking in Explore Dataset. You can filter by main category, for example prices, activity or financial and when selecting each of them, a list of referred datasets is displayed. In addition, you can explore the most recent or most popular datasets simply by clicking "see more" in the corresponding column. Also, below you can find a list of recommended datasets for you, to facilitate your search. In the left column there are different filters such as country, frequency or source, which will be of great help to simplify the search. When searching for a specific dataset utilize the bar on the upper right corner. Use keywords in order to find the data you are looking for. Then, navigate to see the dataset details and find the repository that stores it. You can build lists of favorite datasets to rapidly acces. You can go to the view of the dataset you want and press the Follow option, located under the publisher. To remove it from the list, simply select Unfollow. Another way, is in the...
How can I create a new Dataset

There are 4 ways to create datasets: Uploading by hand from a CSV or XLS. Automatically connecting it to a file in Google Drive As a result of running a pipeline (read more here) Using the API or Python library (read more here) For the first two, on the Create new button at the top right, click on Dataset, after which you can drag the CSV or XLSX file you want to upload or select the Google Drive file you want to connect. How to connect your data Make sure your CSV, XLSX or file from Google Drive has a column with a Date. If you choose the first option, simply select the file from your computer. For the second option, make sure to sign in with Google in order to synchronize your data from Google Drive. Once you have given Alphacast permission, you will be able to add a file from your Google Drive. Select the file you desire. With this option, updates will be made automatically. If you choose an XLSX or CSV, when data is added, you will have to upload your file again. How to configure the columns of a dataset? Once the file is selected,...
How to create a basic chart?
Step 1. Creating the chart There are two ways to create a chart: From scratch: click Create new on the upper right corner and then Chart. You will be redirected to the chart editor From any dataset: you can create a chart from any dataset. When entering to the dataset view, on the right you will find the button Filter. Click on it and below, all the variables will be listed. You can select the variables you want and its transformations. When doing so, in the upper right you will see the Chart Preview. Once all the desired variables are chosen, click on Create chart. It will redirect you to the chart editor, follow the next steps to finish your chart. Step 2. Chart editor and variables selection Clicking on Add variables will display a list with the repositories that you own, the ones that you are part of and those you follow. If you select one of these, it will lead you to a list of variables grouped by datasets. , for example, ''EMAE ''. Inside each dataset, you can also look up for the name of a specific variable in the search option and once selected click "set...
Creating a pipeline do's and dont's
With pipelines you can process the data within the platform. A pipeline is a sequence of steps, transformations and others to be applied to a particular dataset that has the characteristic of updating automatically every time a data is updated. There are two different ways to do this: From scratch: click Create new on the upper right corner and then Pipeline. From any dataset: you can create a pipeline from any dataset. When entering to the dataset view, on the right you will find the button Create Pipe Both options will lead you to the Pipeline Engine. Here you will need to choose the repository where the pipeline will be stored and select a name for it. After that is where the fun begins! First, you will have to choose the dataset you want to work with. Once you save it, you will be able to choose different steps to modify and transform your data as you wish. As an example we chose the following dataset: Inflation - Argentina - INDEC - Consumer Price Index - Groups - Monthly and we applied the following steps: Rename columns: to change the name of one of the variables Change Frequency: to rescale...
Financial Analysis

A couple of months ago we began to work silently on a new set of features requested by users and clients that are finally coming to light. The final objective is to use the pipeline's engine to perform full no-code financial analysis, trading strategy design, and portfolio backtesting. As a first step towards this goal, we have just launched a new step on the pipelines to estimate 130 metrics on financial assets, Metrics include a number of cycles, momentum, volatility and volume Indicators, standard overlap studies, patterns recognition techniques, or statistic functions. This is an example dataset of every metric estimated for AAPL Check out this insights for a full list of functions Cycle Indicators Momentum Indicators Volume & Volatility Statistics Functions Price Transforms Pattern Recognition Overlap Studies Calculating any metrics involves two steps: Load the financial data you want to analyze. Most of the metrics will require open, close, high, low, volume variables to work properly. You can load data directly from Yahoo Finance (see more below) Add a step "Technical analysis". The interface is quite straightforward. Select the function group, the function, the parameters, the prefix (optional) and press save. The new variables will be added to the...
How to convert a series to the official dollar or Blue Chip Swap?

In the new pipeline engine we incorporate a new transformation that allows changing the currency of the original series and that in the case of Argentina has two options: Convert to dollar official or to BCS. The pipeline is separated into three Select ("Fetch") the dataset and its columns (this step is not necessary, but it removes unnecessary data) "Apply transform" by selecting "usddaily", "usdmonthly" or whatever corresponds to the frequency and/or CCL_daily to convert to CCL. Publish the dataset Important: This operation uses the "Country" field to identify the country and know which currency to use. In the case of the official currencies, use this reference dataset for the conversion and in the case of the Argentine CCL...
How is a Time Series seasonally adjusted?

Removing seasonality from time series is always complicated and laborious. The standard deseasonalization method is X-13ARIMA-SEATS or some other version of the methodologies maintained by the United States Census Bureau. Denationalizing usually includes using some application such as Eviews, Demetra or Stata or Python, combining it with the files that are downloaded from Census. Anyone who has also tried to seasonally adjust in Excel knows that it is cumbersome. Just for reference, about the reasons why it is important to deseasonalize the series for the analysis of the situation I wrote this article a while ago. Deseasonalize with Pipelines in Alphacast is very easy and includes only 4 steps: Fetch dataset Filter the columns we want to use (this is not strictly necessary) Apply Transform, choosing the "Seasonal Adjustment" option Publish the dataset As an example, you can see how we deseasonalize the Monthly Estimator of Economic Activity (EMAE) of Argentina This dataset --> With this pipelines --> Posted to this new dataset The benefit of using seasonally adjusted series is seen immediately. The blue series in the following graph shows how the monthly estimate for the category \\\"Agriculture, Livestock and Fishing\\\" evolves over time. You will notice that it...
How to calculate a monthly end-of-period series?

Pipelines are an easy way to apply transformations to datasets that update automatically every time data is updated. Suppose we have a daily data series for which we need only the last value of each month. It is possible to do that in Excel. For example, an auxiliary column is added that is TRUE / FALSE depending on whether or not we are on the last day of the month, and then a pivot table or a filter is created, or another table and a vlookup. EOMONTH, for example, is used for that. Doing it with pipelines basically you don't have to do anything. The transformation is done by itself Step 1. Find the original dataset Suppose we want a monthly exchange rate series for all countries. Something like this exists in this BIS dataset but with daily frequency. "Financial - Global - BIS - Main Currencies" Step 2. Create the pipeline and choose the source With the source dataset identified we are going to create a pipeline (with Engine v2.0). As the first option in "Fetch Dataset" we select the dataset that we found in the previous step Step 3. Resample the frequency and choose the variable and publish...


