Analyze your data within the platform
You do not have to be a data scientist or developer to process, analyze or visualize the data. Alphacast is a Data freeway, and you can step in and out whenever you want.
Save time automatizing your daily work routines.
With Alphacast you can save hundreds of hours of work.
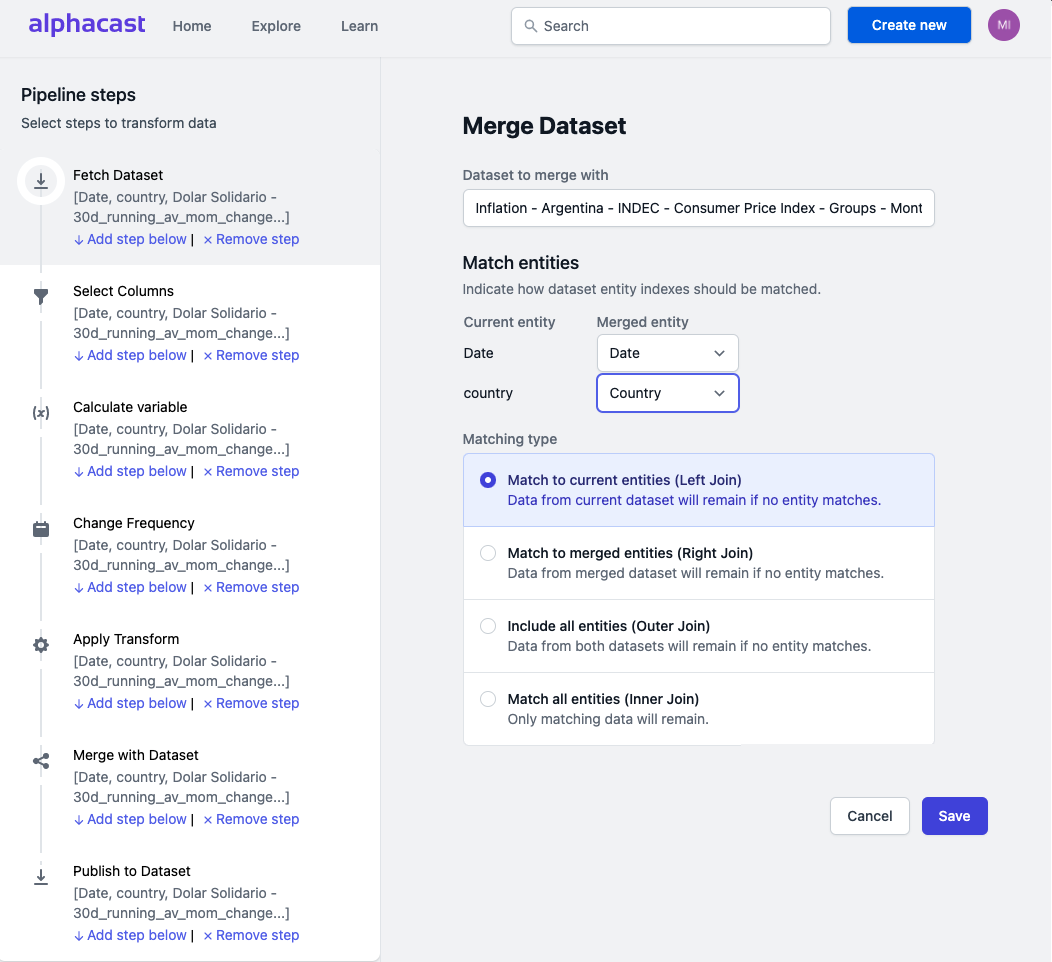
Process the data on the fly with our pipelines engine
- Design your data transformation and have your data automatically proceeses as information is updated.
Select within an extense transformations library
- Choose within one of Alphacast predefined transformations steps: Basic arithmetics and transformations, smoothing and filters, unit conversion, tests and statistics and even econometric models and financial calculations.
Code your own transformation
- Need to run custom made transforms? We can host and run your python code as any other pipeline step.
Integrate the data to your applications.
You don't have to leave you preferred applications! Just integrate Alphacast with your data flows to streamline your analysis.
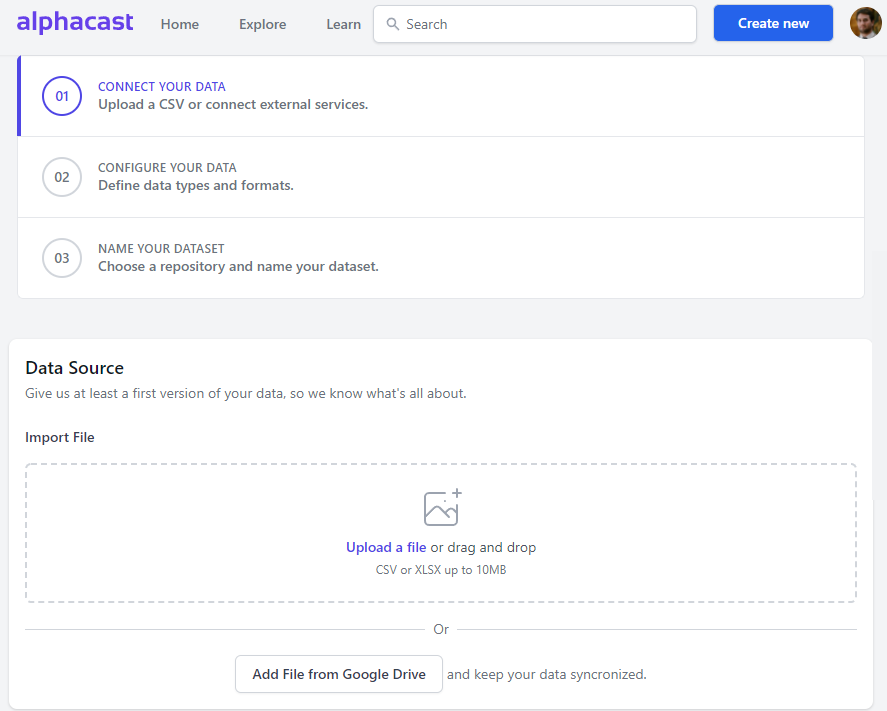
Integrate Alphacast to Excel to download and upload data
- Connect Alphacast datasets to Excel with just a couple clicks (Learn how Here) Upload your data and Keep it synked with Google Drive and other integration options.
Connect the data to your visualization tool
- Connect to Power BI, Tableau, Microstrategy or other charting tools with via our API. See more Here
Create interactive Charts, Maps and Dashboards.
Explore your data with dynamic visualizations. Your charts will be always updated with the latest data the moment it is published, with no addional effort
Pick from multiple different chart types
- Stacked and unstacked lines, bars and aras, slope charts, scatter plots, and plenty more coming down the road. Mapping data is always hard. We help you make it easy. Only fit your country data into a map. Create interactive maps with dynamic timelines.
Build your brand with custom themes
- Standarize your themes. Picking colors and fonts is the main ingredient of any chart. Choose any of our selected palletes or create your own.
Code your own transformation
- Need to run custom made transforms? We can host and run your python code as any other pipeline step.
