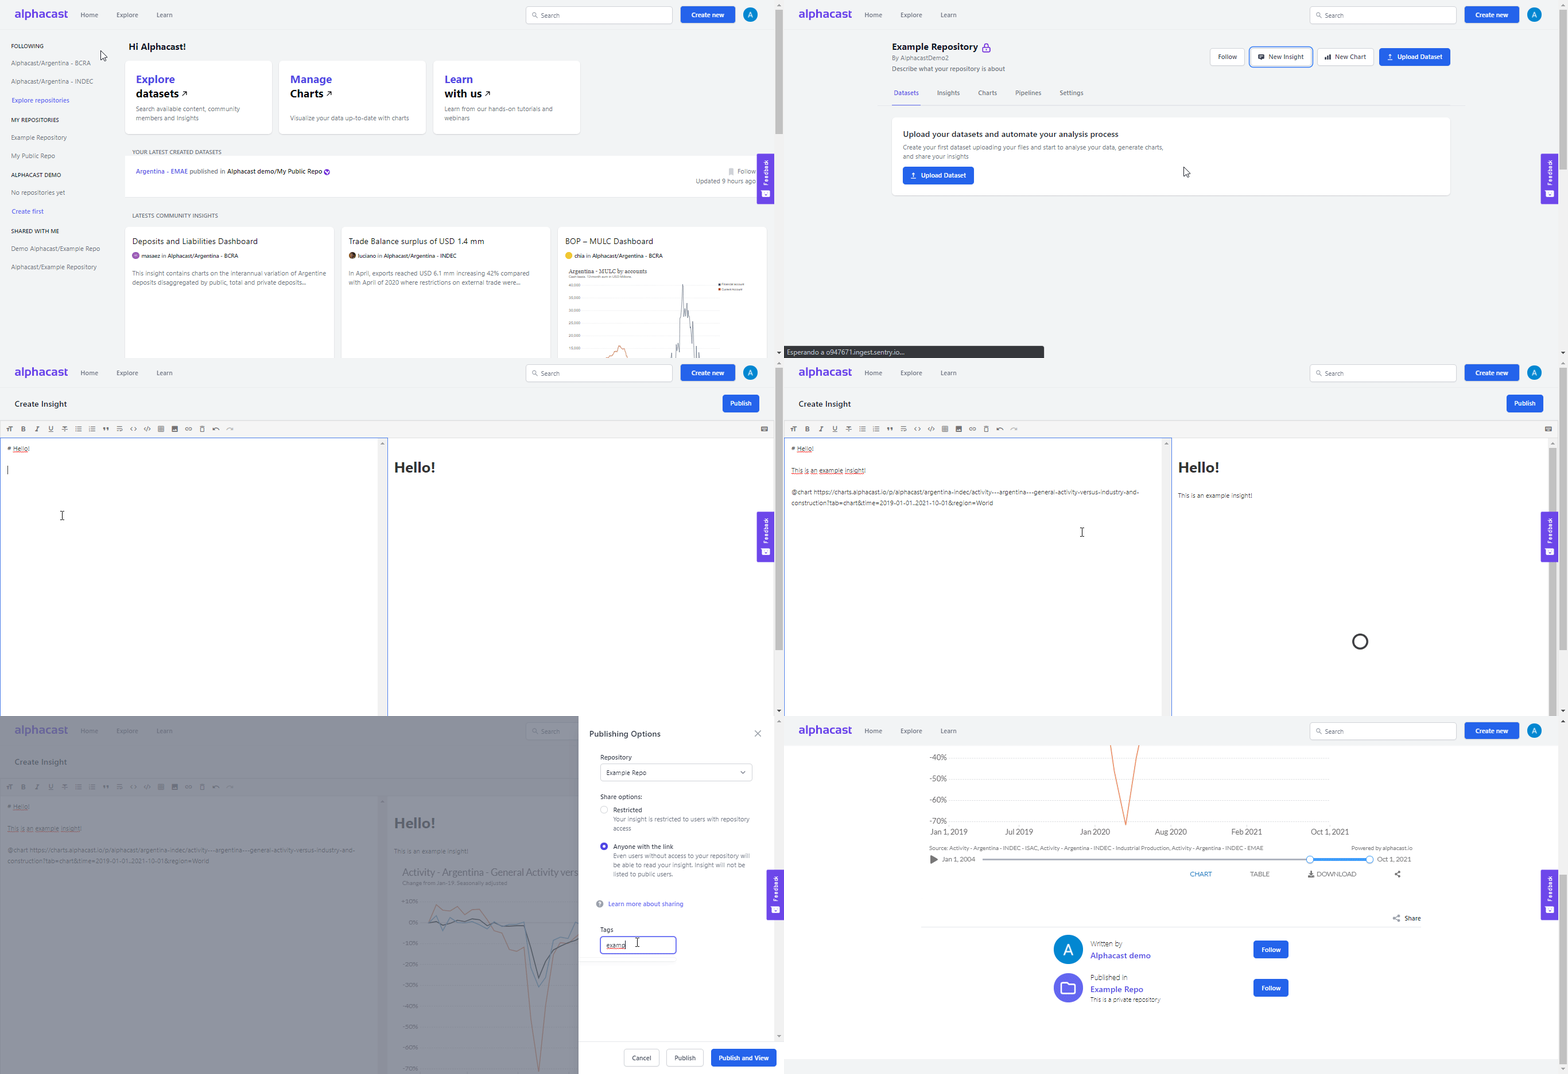
How can I create basic insight, report or dashboard?
To create and publish an insight, find and click the button in the upper right of the site "Create New" and select "Insight". You can also select one of your or your teams repositories and click on “New insight” located on the upper right. The window on the left is the editor. There you can write, insert charts or format your insight. In the window of the right, you can preview your insight.
Follow the instructions already written to help you in the process. Delete them to start writing!
- Headers can be included by using #, ##, ###, ####
- Alphacast charts can be included by using '@chart' and '@Ncharts'. Then paste the URL of the chart you want to include
- Images can be inserted using the icon in the toolbar above
- Explore the toolbar for more options: Bold, Italic, Underline, Striketgeough and more
Insights are created with Markdown language. For a full reference of markdown, features see here
In order to publish the insight you can choose among all the repositories you own, your team owns or you follow. You can also select the privacy of your insight. Finally, you can publish by pressing the publish and view button.

Embedding charts, images, and videos
Alphacast's charts can be added in an insight by using '@chart' and '@Ncharts'. The first option is to paste one chart, the second one is to paste two charts together. To paste an interactive chart, write '@chart' and paste the URL of your selected chart like it is shown in the following gif:

If you want to add a video that was uploaded in another website, you can insert it in your insight by using the embed code generated by that site. For example, this is the first Alphacast webinar, that was posted on YouTube.

In order to add an image, click on the "Image" icon on the bar above and choose the file from your computer. This is, for instance, Alphacast's logo.

Publishing and sharing your insights
Once you are done writing your insight, you can publish it. If your repository is private, you can choose between two options: restricted (your insight is restricted to users with repository access) and anyone with the link (Even users without access to your repository will be able to read your insight. Insight will not be listed to public users.). If your repository is public, your insight can be seen by everyone. Also, you can tag your insight so it will be easier for the community to find it.
Finally, you can publish your insight. If you want to make more changes, click on cancel to keep editing. If you are satisfied, click on publish or publish and view. By clicking on the last option, it will take you to your published insight.

If you want to edit your insight, go to the link of the insight and click on the three dots located on the right. There are other options such as: sharing, deleting and viewing Markdown source. Click on edit and it will take you to the editor view again.
