Alphacast Debt Sustainability Analysis Tool
Contents:
- Introducing a new tool for economic analysis
- Example 1: Brazil's debt looks sustainable
- Example 2: Peru in need of fiscal adjustment
- Methodological appendix
Introducing a new tool for economic analysis
Alphacast has integrated into it's platform a Debt Sustainability Analysis (DSA) Tool. Basically, this tool can help you forecast the Debt/GDP ratio of a country, taking into account specific characteristics such as growth, inflation, interest rates on domestic and foreign debt, exchange rate depreciation and primary surplus. The tool also applies shocks to generate a fan-chart style chart so it can account for uncertainty into the forecasts (see the Appendix for more information). It will take literally less than a minute to generate charts just like this one below. Click here for a detailed explanation on how to use our new tool. Read below some examples to illustrate how to use this tool to produce your own analysis.

Example 1:
Brazil's debt looks sustainable
Over the past few years, Brazil has registered consecutive primary deficits and low growth rates. Recently, the government tried to reduce its primary deficit, so they could put public debt on a sustainable path again. Interesting to note, Brazil has a low ratio of foreign debt: 95% of the debt is composed of domestic debt.
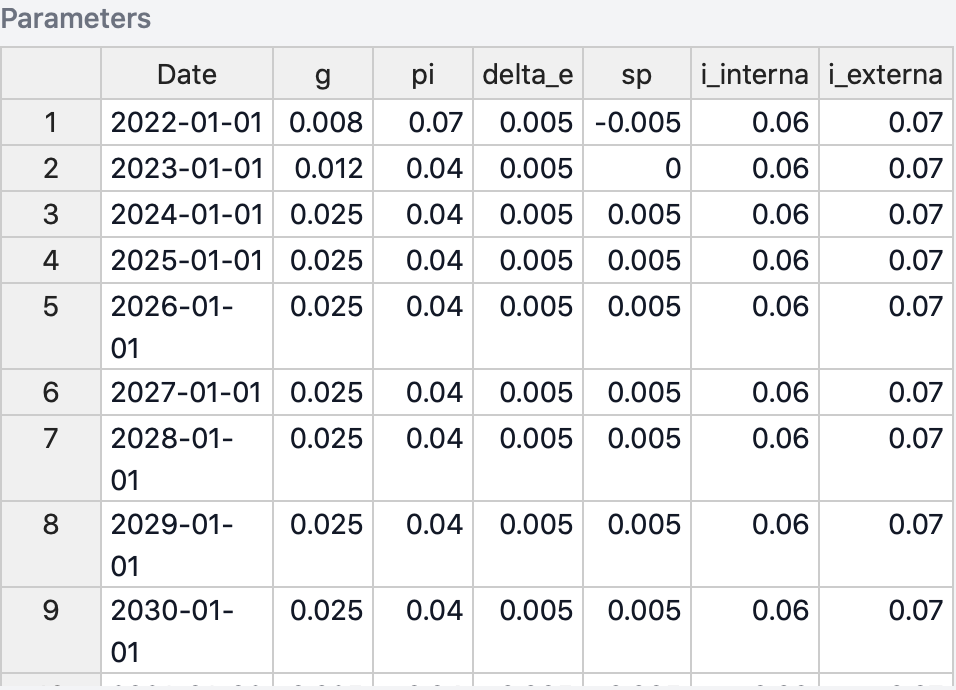
In our base scenario we assume that Brazilian GDP will grow according to market expectations: 0.8% in 2022, 1.2% in 2023 and 2.5% in 2023; keeping the growth rate constant at 2.5% afterwards. For the GDP deflator growth, we keep it at 7% in 2022, and 4% for the other years. Regarding interest rates, we keep the domestic debt rate stable at 6% and the external debt rate at 7%. We consider that the Treasury will be able to adjust fiscal policy and, eventually, register fiscal surpluses. Therefore our baseline is a 0.5% of GDP deficit in 2022, 0% in 2023 and a 0.5% surplus for 2024 onwards. Finally, we keep the depreciation rate at 0.5 % per year.
With this set of assumptions, Brazil's Debt/GDP ratio has a good chance of decreasing. The base scenario (median of the distribution of results), the ratio's trajectory would be slightly descendent, although Brazil would struggle to recover the 58% GDP level of 2015. Applying shocks to the base scenario, our DSA model shows that in 25% of the simulated cases, debt would be higher than 93% GDP by 2029. The chart below shows results of the DSA for different quantiles of our simulations.

The dynamics for each variable included in the DSA can be seen below. They include trajectories under shocks to the baseline scenario (quantile 50).


Example 2
Peru in need of fiscal adjustment
Peru has been one of the countries with the highest growth rate in Latin America during the last decade. It has also maintained a pretty stable macroeconomy, including a low ratio of Debt/GDP. However, since 2015 the country has faced consecutive primary deficits, which increased public debt from 17% GDP in 2015 to 30% in 2021.
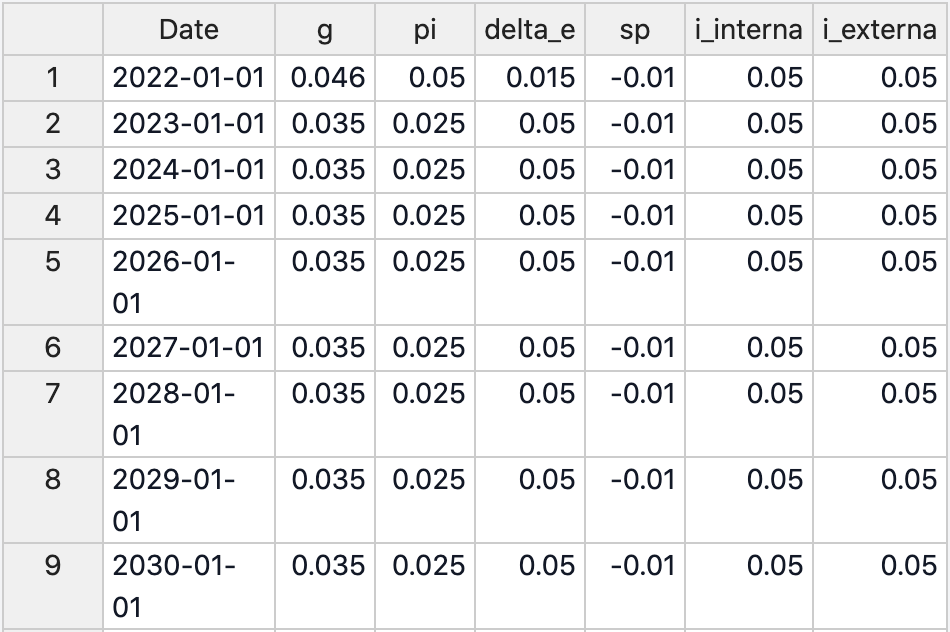
In our base scenario, Peru keeps a constant growth rate of 3.5% per year, with GDP deflator growing 5% in 2022 and 2.5% from 2023 onwards. For the sake of illustrating a point, we assume no fiscal consolidation: the primary deficit would remain constant at 1% GDP per year. Both the domestic and foreign debt interest rates are kept constant at 5%, and the depreciation rate would be of 1.5% in 2022 and then 5% per year.
Results are not surprising: if Peru does not change its fiscal stance, debt dynamics will deteriorate. This does not imply that the country will be on the brink of default, but in the base scenario debt would increase from almost 31% GDP in 2021 to 42% in 2030. The DSA also reports a 25% chance that debt would be over 54% GDP, if Peru's economy suffers negative shocks.
The DSA tool also allow us to easily create and compare different scenarios. We define an alternative scenario in which Peru pursues the fiscal consolidation path by changing the primary balance forecasts. In this alternative scenario, we assume a 0.5% GDP primary deficit for 2022 (+0.5pp compared to the base scenario), 0% in 2023 (+1pp) and a 0.5% GDP fiscal surplus from 2024 onwards (+1.5pp).
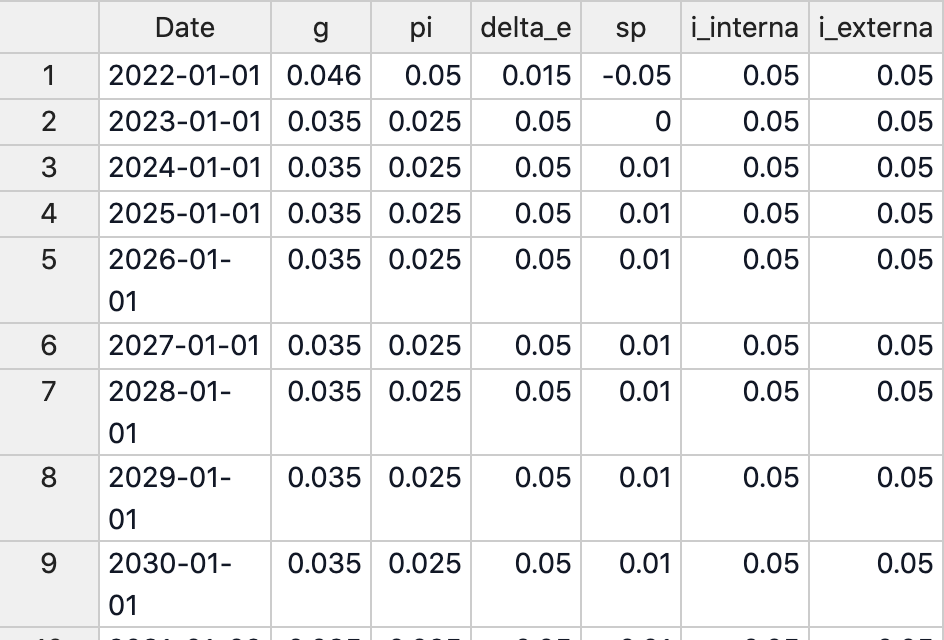
Comparing both scenarios yields an obvious conclusion: if Peru adjusts fiscal policy to achieve primary surpluses by 2024, debt dynamics would be less stressful than under the current fiscal path. The Debt/GDP ratio would decrease to 27% GDP by 2023, below both the base scenario forecast and the starting point of the simulation.
Appendix
Our Debt Sustainability Model uses the standard debt dynamic equation to generate forecasts for the Debt/GDP ratio throughout the next 10 years. Specifically, we use the following the equation:
In which:
is the ratio Debt/GDP for the t+1 period;
is the share of foreign debt in relation to total debt;
is the real growth of GDP at the period t;
is the variation of the GDP deflator for the period t;
is the devaluation of the exchange rate between the local currency to the US dollar during the period t;
is the implicit interest rate for the domestic debt, it is calculates as the ratio between the interest paid for the internal debt during the period t and the internal debt in the period t-1;
is the implicit interest rate for the foreign debt, it is calculates as the ratio between the interest paid for the internal debt during the period t and the internal debt in the period t-1;
is the primary deficit of the government during the period t.
We measure the public debt and the primary déficits according to the Non-financial Public Sector concept, but this might change according to the available statistic for each country.
We account for uncertainty by applying random shocks for each variable. These shocks are constructed by simulating a Multivariate Normal Distribution that uses as input the historical covariance matrix between those variables and their forecasts for the next 10 years. We simulate 2000 shocks for each each year and compute the quantiles of the Debt/GDP forecasts according to our DSA equation.
