
Exploring Alphacast
By Alphacast
Exploring Alphacast's insights

Alphatour: Navigating Global Financial Data with Alphacast

Prepare for our worldwide data availability! Check out all Global Datasets here. Alphacast has become a crucial tool for those seeking up-to-date and high-quality information on global economy, market fluctuations and financial trends, as it provides easy and fast access to a wide variety of large-scale data sources, allowing for precise and comprehensive analysis and metrics. Acces to financial data is of vital importance, due to this we offer a wide variety of repositories with valuable information that will be essential when our users perform analysis and metrics on various topics and sectors of economies located throughout the world. Below, you will find a list of the most reputable sources for international data. The Organization for Economic Cooperation and Development (OECD) is an intergovernmental organization composed of 38 member countries, which primary aim is to promote economic well-being and international trade. The OECD is also responsable for collecting, analyzing and publishing information and statistics on a wide range of environmental, economic, and social worldwide issues. Financial & Monetary datasets: Finance, Monetary & Financial, Balance of Payments & International Trade The Board of Governors of the Federal Reserve System (FED) is the central bank of the United States. FRED also operates...
A short guide to US Inflation data

Highlights of the Dynamic of US Inflation The United States has been struggling with a significant inflationary acceleration since the serie of international events, including the outbreak of the COVID-19, war between Ukraine and Russia, the global rise in energy prices, and the collapse of Silicon Valley Bank, among others. All of those factors has contributed to a complex inflation scenario, inside which companies and consumers must seek strategies to manage. Increasing prices not only reduces the purchasing power of consumers and affects their consumption patterns, but also has far-reaching implications for the real estate sector and the progression of wages Besides this context, actualized data of the topic is crucial for businesses and policymakers in better undestanding of the current economic landscape. A couple of the following sources are claimed to be fundamental in the process of monitoring the inflation issue in the United States. Take a look on this US Inflation Dashboard here The Bureau of Labor Statistics (BLS) publishes detailed information on inflation, particularly through the Consumer Price Index (CPI), which is broken down by categories and types of goods. Access to this reliable data for your research with AlphaCast's datasets: Consumer Price Index Consumer Price Index...
A short guide to Ecuadorian macro and financial data

Interested in activity, prices, monetary, fiscal, external sector, and financial data for Ecuador? There are loads of datasets, available in both the Central Bank of Ecuador (BCE) and National Institute of Statistics (INEC) repositories, both containing oficial statistics from from different sources. The data is fully integrated with our database which means once the sources release it, our database will be instantaneously updated on our platform. If you are looking for data about Ecuador you'll probably find it there. However, this short guide will help you find the basic "must-see" datasets. Our Datasets are contained in five sections: Activity, Prices, Money and Banking, Fiscal, External Sector and Financial. Activity To track the economic activity of the Ecuadorian Economy, you can monitor the evolution of GDP, Industrial Production, Employment and Wages. Quarterly Gross Domestic Product Monthly Gross Domestic Product Employment Indicators Wages This is just a small sample of all the datasets we make available to our users, but there is more information that we know you will find useful such as fuel production or consumer confidence. Moreover, data is pre-processed within the platform so that you don't have to spend time doing transformations such as Seasonal Adjustment, currency change, %...
A short guide to Chilean macro data

Interested in activity, prices, monetary, fiscal, external sector, and financial data for Chile? There are loads of datasets, see for example this Repository which has official statistics from INEI and BCRP. However, this short guide will help you find the our "must-see" datasets. Chile Country Profile Dashboard The starting point is our Chile Macro Dashboard, a fully automatized Dashboard presenting up-to-date data. You can catch a glimpse and get a broad idea of the latest developments. It contains five sections: Activity, Prices, Money and Banking, Fiscal, External Sector, and Financial The Charts are fully integrated with our datasets, so if you want to replicate any of them, you can download the source Dataset, or just click the button “Clone Chart” to reproduce the Chart inside our Platform. The main sources for the data used on this Dashboard come from the Central Bank of Chile (BCCh), the National Institute of Statistics (INE), and Chile's National Department of Treasury. The data is fully integrated with our database which means once the sources release the data, our database will be instantaneously updated on our platform. Activity To track the economic activity of the Peruvian Economy, you can monitor the evolution of GDP, Industrial...
A short guide to Uruguayan macro and financial data

Interested in activity, prices, monetary, fiscal, external sector, and financial data for Uruguay? There are loads of datasets, see for example this Repository which has oficial statistics from from different sources, including both government statistics and datasets produced by private entities. If you are looking for data about Uruguay you'll probably find it here. However, this short guide will help you find the basic "must-see" datasets. Uruguay Country Profile Dashboard The starting point is our Uruguay Macro Dashboard, a fully automatized Dashboard presenting up-to-date data. You can catch a glimpse and get a broad idea of the latest developments. The Charts are fully integrated with our datasets, so if you want to replicate any of them, you can download the source Dataset, or just click the button “Clone Chart” to reproduce the Chart inside our Platform. The main sources for the data used on this Dashboard come from the Central Bank of Uruguay (BCU), the National Institute of Statistics (INE) and Uruguay's Ministry of Economy and Finances. The data is fully integrated with our database which means once the sources release the data, our database will be instantaneously updated on our platform. Our Dashboard contains five sections: Activity, Prices, Money...
A short guide to Mexican macro and financial data

Interested in activity, prices, monetary, fiscal, external sector, and financial data for Mexico? There are loads of datasets, see for example this Repository which has oficial statistics from from different sources, including both government statistics and datasets produced by private entities. If you are looking for data about Mexico you'll probably find it here. However, this short guide will help you find the basic "must-see" datasets. Mexico Country Profile Dashboard The starting point is our Mexico Macro Dashboard, a fully automatized Dashboard presenting up-to-date data. You can catch a glimpse and get a broad idea of the latest developments. The Charts are fully integrated with our datasets, so if you want to replicate any of them, you can download the source Dataset, or just click the button “Clone Chart” to reproduce the Chart inside our Platform. The main sources for the data used on this Dashboard come from the Central Bank of Mexico (Banxico), the National Institute of Statistics and Geography (INEGI) and Mexico's Department of the Treasury (SHCP). The data is fully integrated with our database which means once the sources release the data, our database will be instantaneously updated on our platform. Our Dashboard contains five sections: Activity,...
A short guide to Peruvian macro data

Interested in activity, prices, monetary, fiscal, external sector, and financial data for Peru? There are loads of datasets, see for example this Repository which has official statistics from INEI and BCRP. However, this short guide will help you find the our "must-see" datasets. Peru Country Profile Dashboard The starting point is our Peru Macro Dashboard, a fully automatized Dashboard presenting up-to-date data. You can catch a glimpse and get a broad idea of the latest developments. It contains five sections: Activity, Prices, Money and Banking, Fiscal, External Sector, and Financial. The Charts are fully integrated with our datasets, so if you want to replicate any of them, you can download the source Dataset, or just click the button “Clone Chart” to reproduce the Chart inside our Platform. The main sources for the data used on this Dashboard come from the Central Bank of Peru (BCRP), the National Institute of Statistics and Information (INEI), and Peru's Ministry of Economy and Finances (MEF). The data is fully integrated with our database which means once the sources release the data, our database will be instantaneously updated on our platform. Activity To track the economic activity of the Peruvian Economy, you can monitor the...
A short guide to Brazilian macro and financial data

Interested in activity, prices, monetary, fiscal, external sector, and financial data for Brazil? There are loads of datasets, see for example this Repository which has official statistics from BCB and IBGE. However, this short guide will help you find the our "must-see" datasets. Brazil Country Profile Dashboard The starting point is our Brazil Macro Dashboard, a fully automatized Dashboard presenting up-to-date data. You can catch a glimpse and get a broad idea of the latest developments. It contains five sections: Activity, Prices, Money and Banking, Fiscal, External Sector, and Financial. The Charts are fully integrated with our datasets, so if you want to replicate any of them, you can download the source Dataset, or just click the button “Clone Chart” to reproduce the Chart inside our Platform. The main sources for the data used on this Dashboard come from the Central Bank of Brazil (BCB), The Brazilian Institute of Geography and Statistics (IBGE), and Brazil's Ministry of Economy. The data is fully integrated with our database which means once the sources release the data, our database will be instantaneously updated on our platform. Activity To track the economic activity of the Brazilian Economy, you can monitor the evolution of GDP,...
How to integrate Alphacast with Excel for Mac?

Step 1. Getting the URL link from the dataset or pipeline You will need the complete URL for the dataset that you want to integrate, which you can find by clicking the Download button and then copying (not downloading!) the URL attached to a TSV file. Alternatively, you can use the Data Snapshot link from any pipeline. Remember to choose the TSV link. Step 2. Creating a query file Open a Word file and paste the URL link. Save the document with the “.txt” extension (text without format), not as a Word file. When asked about text codification, choose MS-DOS. After saving the file, manually change its extension from “.txt” to “.iqy”. Step 3. Integrating with Excel Open a new spreadsheet, go to “Data”, then “Import External Data” and click on “Execute Web Query”. Excel will require you to choose a query file (those with “.iqy” extension), so search for the file you generated previously and open it. That’s it! Excel should have successfully integrated an Alphacast dataset/pipeline to your spreadsheet. Remember to click on “Refresh” to obtain data updates when...
8 amazing econdashboards you cannot miss!

Stop spending your day copying & pasting data from sources that frequently change their formats, and get your charts updated right away. Dashboards are updated every day with the most recent data. Remember that you can copy and clone everything you see on those dashboards. Create your charts or pipelines to transform the data, and add your format, colors, and brand. Feel free to reuse everything of your own will. As a model for inspiration, we would like to share with you 8 curated dashboards from our team. Global Central Banks Dashboard Alphacast's Dashboards are the perfect tool to keep track of global monetary events. The Global Central Bank Dashboard has an up-to-date view of monetary policy in the Federal Reserve, ECB, Bank of England, Bank of Japan, and the People's Bank of China. Penn World Tables' Dashboard The Penn World Table, created by the Groningen Growth and Development Centre, is a project to compare world macro data in the long term, on relative levels of income, output, input, and productivity, covering 183 countries between 1950 and 2019. Latin American Overview Dashboard Alphacast shines the most when combining data from dozens of sources that would otherwise require lots of work....
How can I create a basic dashboard?
Here you will find some examples that will be useful when building your own dashboard Saving charts on your clipboard Before you start creating your first dashboard, it's useful you preselect the charts that you want to work with using the clipboard. The clipboard allows you to have all the charts you want to add at hand. Access it via the hook button at the top right of the screen For that, you will have to click on the clip chart button below each graphic and voila, it is already saved in the clipboard. Dashboard --> clipping charts In case you want to use charts from another dashboard, don't forget to make the chart interactive so you can clip it. Dashboard --> Switching to Interactive Starting point To create and publish a dashboard, find and click the button in the upper right of the site "Create New" and select "Insight". The window on the left is the editor. There you can add a title, subtitles, and all the charts you want to visualize on your dashboard. The window on the right shows a previsualization of the left side. Follow the instructions already written to help you in the process but...
A short guide to Argentinean macro data
Interested in activity, prices, monetary, fiscal, external sector, and financial data for Argentina? There are loads of datasets, see for example this Repository which has oficial statistics from from different sources, INDEC's Repository and BCRA's Repository. If you are looking for data about Argentina you'll probably find it here. However, this short guide will help you find the basic "must-see" datasets. Argentina Country Profile Dashboard The starting point is our Argentina Macro Dashboard, a fully automatized Dashboard presenting up-to-date data. You can catch a glimpse and get a broad idea of the latest developments. The Charts are fully integrated with our datasets, so if you want to replicate any of them, you can download the source Dataset, or just click the button “Clone Chart” to reproduce the Chart inside our Platform. The main sources for the data used on this Dashboard come from the Central Bank of Argentina (BCRA), the National Institute of Statistics and Censuses (INDEC) and Argentina's Ministry of Economy (MECON). The data is fully integrated with our database which means once the sources release the data, our database will be instantaneously updated on our platform. Our Dashboard contains five sections: Activity, Prices, Money and Banking, Fiscal, External...
A short guide to Colombian macro data

Interested in activity, prices, monetary, fiscal, external sector, and financial data for Colombia? There are loads of datasets, see for example this Repository which has oficial statistics from the country. If you are looking for data about Colombia you'll probably find it here. However, this short guide will help you find the basic "must-see" datasets. Colombia Country Profile Dashboard The starting point is our Colombia Macro Dashboard, a fully automatized Dashboard presenting up-to-date data. You can catch a glimpse and get a broad idea of the latest developments. The Charts are fully integrated with our datasets, so if you want to replicate any of them, you can download the source Dataset, or just click the button “Clone Chart” to reproduce the Chart inside our Platform. The main sources for the data used on this Dashboard come from the Colombian Central Bank (BanRep), the National Administrative Department of Statistics (DANE) and Colombia's National Department of Tresaury (MHCP). The data is fully integrated with our database which means once the sources release the data, our database will be instantaneously updated on our platform. Our Dashboard contains five sections: Activity, Prices, Money and Banking, Fiscal, External Sector and Financial. Activity To track the...
A short guide to Argentina's Financial and Monetary Data

There are more than 2.000 datasets in Alphacast, and there are plenty of hidden gems. This is a short "Must see" guide for those interested in Argentina's financial and monetary data. **Would you like to know more? Write to hello@alphacast.io o book a demo!** There are lots of based on the data from IAMC daily reports. We encourage you to take advantage of the following datasets: Bonds: Sovereign, Subnational and Corporate IAMC's bonds index in ARS and USD. Treasury Bills: both fixed-rate (LEDES) and inflation-linked (LECER) Leading Equity Trading Volumes Moreover, historical data series for sovereign bonds can be found in this dataset while this one is always updated with the last price Users have also created some pipelines based on this data. For example, you can see (and clone) this pipeline that calculates C vs D spreads or this one, that estimates MEP and CCL from bonds prices Two weeks ago we began publishing detailed datasets for the Mutual Funds industry, based on CAFCI daily reports. You can access that data in these two repositories (1 and 2 ) Net Worth by Fund Detailed Portfolio by Fund (https://www.alphacast.io/datasets/29744) Effect Price and Subscription by Fund and Class (Data and Calculation...
Pipelines examples and tutorials
How do I calculate a monthly end-of-period series from daily data? How do I change the frequency of the data? How can I merge two datasets into one? How can I connect the results of my pipeline to Excel? How is a time series seasonally adjusted? How do I change a local currency series to dollars? How can I download Data from Yahoo Finance? How can I download Data from FRED? How can I remove or regroup entities of my dataset? How can i reshape my dataset from "Wide" format to "Long" format and...
Pipeline's Steps Library
Index - Data Sources - Dataset Transforms - Basic Arithmetics - Finance - Publish data Data Sources Fetch Dataset: This step allows you to choose the dataset to which the sequence of pipeline steps can be added. This step is already predefined and is usually the first step of a pipeline Learn More Fetch Yahoo Finance: Yahoo Finance has information on hundreds of thousands of financial assets, stocks, bonds, ETFs, Indices, which are now easily accessible using Alphacast pipelines. Learn More Fetch FRED: If you work with economic data you probably know FRED, the massive database created by the US Federal Reserve Bank of Saint Louis, that claims to have 816,000 US and international time series from 108 sources. You can now access all that data directly into Alphacast, using Alphacast pipelines.. Learn More Dataset Transforms Select Columns: This step allows to filter columns and reduce the number of data to be processed in the following step. The variable selector will show the data up to that point in the pipeline. Learn More Rename Columns: the user can choose the name for each column by filling in the blank space to the right, or keeping the original name by leaving...
Creating tables with Pipelines

Our Pipelines feature is a powerful tool which allows report automatization. Let's say, for example, that you want to create an insight which shows dynamics of Argentina FX rates and a table with latest data, including percent changes. Wait! Did you just say "a table"!? With Pipelines you can transform datasets in multiple ways (for many other uses, see here). One possibility is to reduce the input dataset to a smaller version of itself, and then embed the outcome in an insight as a table. Let's show you how to do it, step by step. How to create a table 1) To begin with, let's fetch the input dataset. This is the dataset we want to work on, which will be later reduced to a table. In our example, we'll be working with the Financial - Argentina - FX premiums - Daily dataset. 2) If the input dataset has columns which we want to discard, let's use the "Select" step to keep only what we need for our table. In this case, it will be columns associated with the different FX rates (Blue, Dolar MEP, Dolar CCL, Dolar Mayorista, Dolar Oficial). Feel free to skip this step if you don't...
How to create tables: Example

Argentina FX rates This is an example of how to create automated reports which include charts AND tables. For a step-by-step process of how to create tables, read...
How can I create a Portfolio Tear-Sheet?

Alphacast pipelines can be used to design and test portfolio and trading strategies. With the "Porfolio Analysis" Step on the pipeline editor you can create tear-sheets from daily returns and also dynamic rolling stats for different timeframes. Step 1. Load the data and calculate a daily return variable. You can use any dataset you want to calculate daily returns. As an example, let's load Yahoo Finance data and calculate the daily return of three assets In the pipeline editor (Click on create new at the top right --> Pipeline) Add Yahoo Finance as your source add the tickers that you want to analyze (i.e. MSFT, AAPL, GOOG) Select the period add a new step to "Calculate Variable" write the formula pct_change(@Close,1,@Ticker) Step 2. Calculate the portfolio Tear Sheet Add a new step "Portfolio Analysis" Select the metrics that you want to calculate for your portfolio. Available stats are'**Annual return, Cumulative returns, Annual volatility, Sharpe ratio, Calmar ratio, Stability, Max drawdown, Omega ratio, Sortino ratio, Skew, Kurtosis, Tail ratio, Daily value at risk, Total Return Select the variable with the daily returns. "pct_change" in this example If Tear-sheet option is on then a single Tear sheet with results will be calculate...
How to calculate a variable with the formula editor
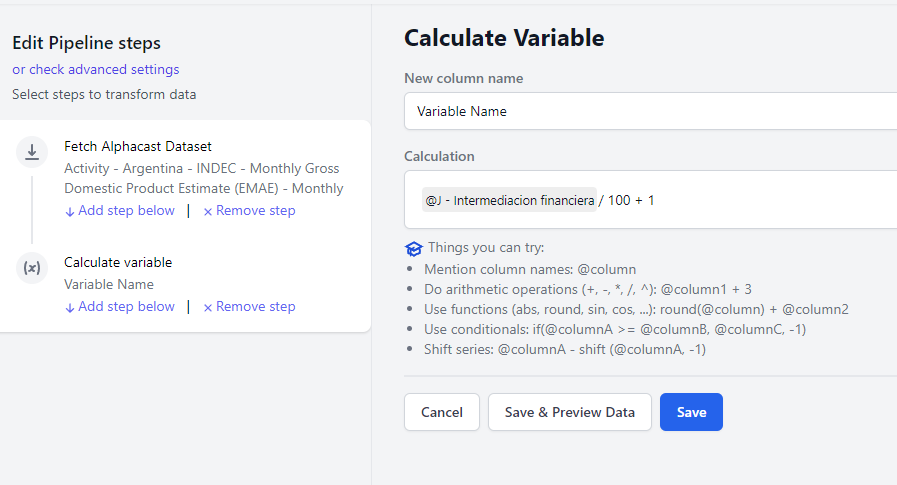
The calculate variable step is an all-purpose formula parser to create new variables in a more "Excelish" way. There are dozens of operators, comparisons, and functions that allow endless combinations. For a comprehensive list of functions and operands see here Video Tutorial (Spanish) First step. Writing a basic formula The first step is to create a pipeline (click on "Create new --> Pipeline" on the top right) and select a data source, followed by "add step below --> Calculate Variable" There are a couple of rules to creating new variables Select a name on the textbox. If you select a variable name that already exists it will be overwritten You can use @ to select variables of the dataset. Start writing the name of the variables and options will show up You can do basic arithmetic operations such as (+, -, *, /, ^): @column1 + 3 You can use functions by typing the name followed by parenthesis and commas to separate parameters: round(@column) + @column2. Full list of functions is here: here. The formula will always return the same number of rows as the original datasets, even if it involves calculations that usually reduce the dimensionality such as "Total...
Formula Editor: All functions and operators
Operators "+": Add. A + B "-": Substraction. A - B "": Multiply. A B "/": Divide. A / B "^": Power. A ^ B Comparison ">": Greater. ">=": Greater Than "": Not Equal "= 0, 1, -1) Row Functions These functions are calculated through all the values of the column (different than group functions below) "power": Power(A, B) "exp": Exponential(A, B) "sqrt": Square Root(A) "log": Log(A) "log10": Log10(A) "sgn": Sign. Positive = 1, Negative -1. sng(A) "abs": Absolute value. abs (A) "trunc": Truncate integer. trunc(A) "round": Round to N digits. round(A, N) "floor": Closest intereg lower or equal than value. floor(A) "ceil": Closest intereg higher or equal than value. ceil(A) "sin": sin "cos": cos "tan": tan Group Functions These functions are calculated within groups. Groups are defined by the columns defined by the parameters. The default groups are the entities of the Dataset (excluding the Date columns) "rank": Compute numerical data ranks (1 through n) rank(@Variable, @entity1, @entity2, ...) "cummax": Cumulative max per group. cummax(@Variable, @entity1, @entity2, ...) "cummin": Cumulative min per group "cumprod": Cumulative min per group "cumsum": Cumulative sum per group "cumcount": Cumulative count per group "backfill": backfills NA values "pad": forward fills NA values "pctchange": pctchange...
Automatización de Análisis de Coyuntura – Clase 3

Integración con Python, Excel, Google Drive y Power BI Los basics de Alphacast fueron cubiertos en la clase 1, que pueden encontrar en los siguientes links (contenidos, video). En la clase 2 se cubrieron temas relacionados con el data flow: cómo usar los pipelines y transformar los datos dentro de la plataforma. El contenido está disponible aquí (contenido, video). Hoy vamos a ver cómo integrar Alphacast a otras herramientas de uso cotidiano en el proceso de análisis. La idea es explicar cómo hacerlo mediante ejemplos, construyendo sobre la base de lo que hacemos en cada sección. El miércoles 30 de marzo habrá una intro a Web Scrapping con Python y luego vienen 3 clases especiales: intro a Algotrading, intro a Forecasting de Series de Tiempo e intro a Machine Learning. Tip: recuerden que todo lo que vamos a ver (y lo que pueden hacer en la plataforma), está disponible en el Learning Center de Alphacast. Y nuestro equipo está disponible para brindarles asistencia en Discord. 1. Integración con Google Drive La integración con Google Drive nos permite trabajar localmente y actualizar datasets en la plataforma de manera ágil y sencilla. El detalle del paso a paso lo pueden revisar aquí....
Automatización de Análisis de Coyuntura - Clase 1

Introducción general. Objetivos del Curso Alphacast Basics [HOY] Datasets, Charts, Maps y Dashboards Data Flows: Pipelines y Transformaciones Integrations: Python, Excel, Google Drive, Power Bi Aplicaciones y casos de uso Intro to Web Scrapping in Python Intro a Algotrading Intro to Time Series Forecasting Intro a Machine Learning Alphacast Basics Nuestro objetivo es ayudar a los equipos y profesionales de Economía y Finanzas a encontrar, procesar y compartir datos y analisis. Perfil de usuarios de Alphacast: Estudiantes, aficionados a la economía y finanzas, Consultoras, Analistas de Research de Bancos, Fondos de Inversion, Brokers, Centros de Investigación y Think Tanks El contenido de la plataforma. ¿Que? ¿Quien? ¿Como? ¿Donde? ¿Quien produce el contenido? Alphacast Open source Featured Publishers Los Usuarios El contenido puede ser publico, privado o bajo suscripción. Alphacast es una plataforma donde puede comprar y vender datos y analisis Algunos ejemplos: Econviews, Enrique Roura, Ivan Baumann, CREEBA, ECON-UY ¿Cómo encuentro el contenido? Search Explore Community Tags / Filters ¿Las distintas "Clases" de contenido? Creacion de Datasets, Charts, Maps y Dashboards Creación, actualización y manejo de datos La vista del dataset Download Filter Transform Data [proxima clase] Sync Now --> Open Source ¿Que son las entities? Conectando un Dataset a...